Track 0: The Active Trading Decision
The opening gate. Before learning any trading technique, decide whether active trading is worth doing at all. Benchmark every future track against the passive indexing alternative after costs, taxes, time, and realistic mistakes.
Why the First Question Matters Most
Most people who decide to learn active trading skip the most important decision they will ever make about it. They go straight to the craft — candlestick patterns, momentum indicators, options strategies, order flow — and treat the question of whether to trade actively at all as something that will sort itself out later. It rarely does. What happens instead is that months or years into the learning process, after real money has been committed and real losses absorbed, the underlying question surfaces anyway. By then, it carries an uncomfortable weight: not "should I learn this?" but "was any of this worth it?"
This lesson exists to ask that question first. Not to answer it for you — the answer depends on facts only you can supply — but to build the habit of asking it rigorously. Active trading is the practice of making discretionary decisions about which securities to buy, when to hold them, and when to sell, with the expectation that those decisions will produce better outcomes than simply holding a diversified portfolio and doing nothing. The word expectation is doing serious work in that sentence. Expectations can be well-founded or they can be inherited from survivorship bias, marketing, and the very human tendency to notice wins more vividly than losses.
This lesson treats the active trading decision as a prerequisite gate — something you pass through consciously, with eyes open, before investing time in any specific trading track. A gate is not a wall. It does not say "stop." It says "make sure you know what you're choosing, and why."
The Uncomfortable Baseline
Before examining the decision itself, it helps to state the baseline reality plainly.
Studies of retail trader performance, conducted across multiple markets and time periods, consistently find that the majority of individual active traders underperform a simple, low-cost index fund once you account for transaction costs, taxes on realized gains, and the time invested in managing positions. This is one of the most replicated results in financial economics, and it holds across a wide range of trading styles, experience levels, and market conditions. Costs compound against you. Behavioral tendencies — overtrading, panic-selling, chasing recent winners — have predictable effects. And the market is populated by well-capitalized, technologically sophisticated counterparties on the other side of many retail trades.
🎯 Key Principle: The baseline is not "doing nothing." The baseline is a diversified index fund, bought and held, with minimal friction. That is what active trading must beat to justify its added complexity — and beating it is harder than it appears.
If you skip the gate, you are implicitly assuming you will outperform this baseline. That assumption needs to be examined, not inherited.
💡 Real-World Example: Imagine two people who both read the same trading book, take the same online course, and open accounts at the same broker. Neither has asked whether active trading, for their specific financial situation and cost profile, is likely to beat just buying an index fund and contributing to it monthly. Both are learning the craft before deciding whether the craft is worth learning. This is the default path — and it is the path this lesson is designed to interrupt.
Why Learners Skip the Question
Understanding why the gate gets skipped is as important as understanding what it costs.
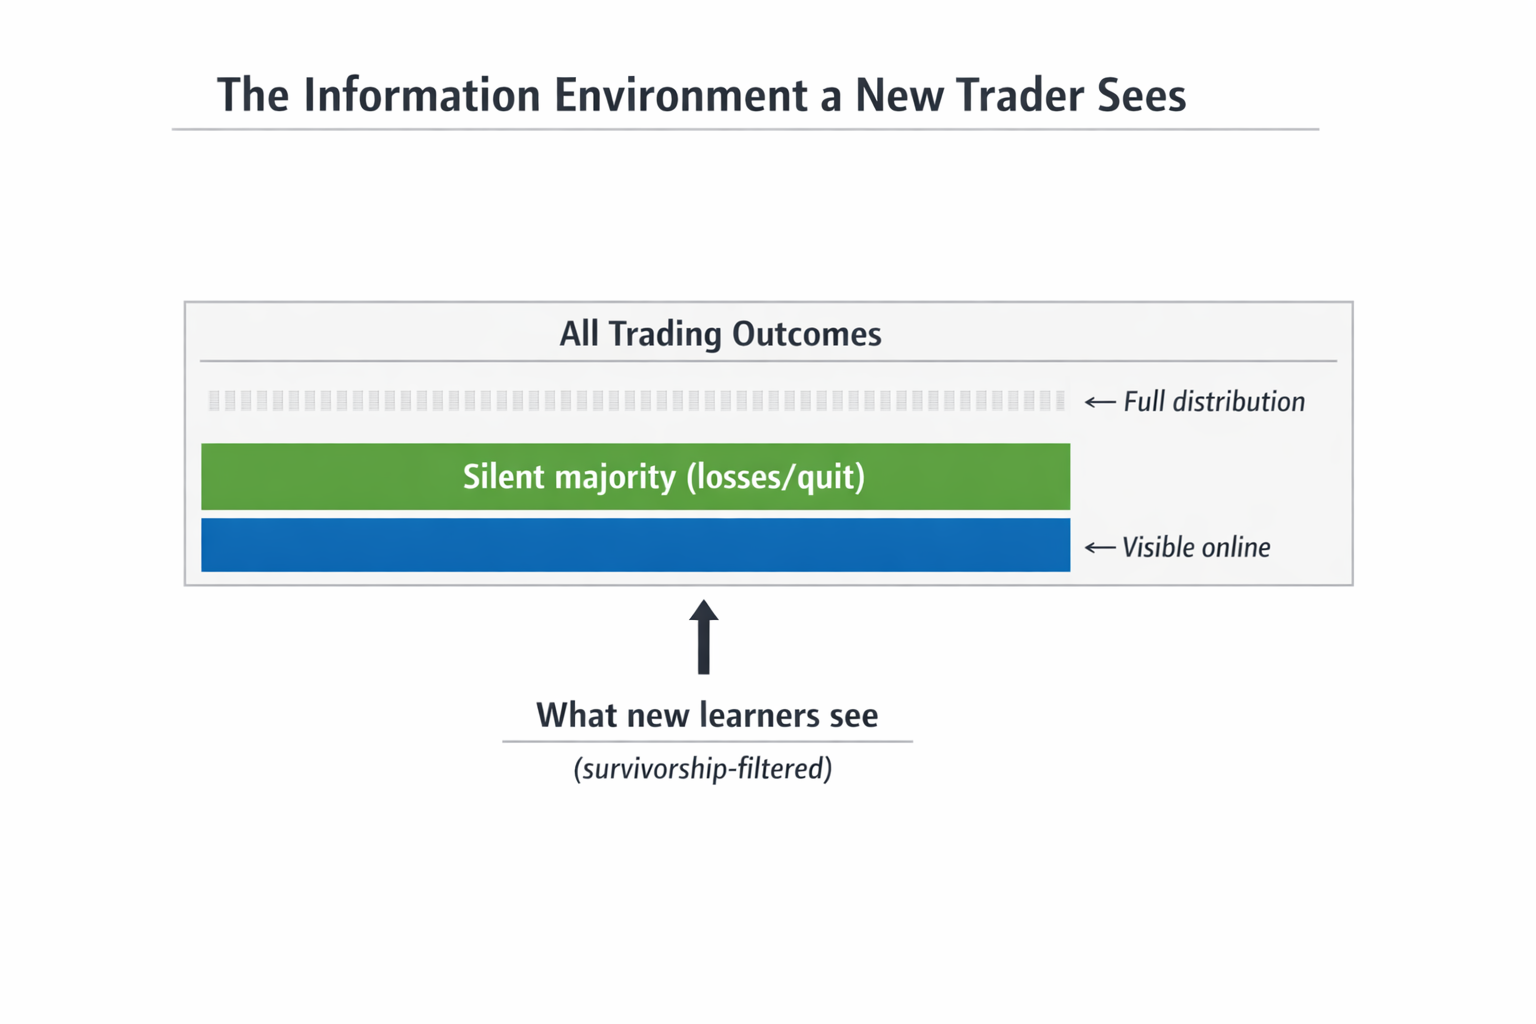
The first force is the selection environment. The content produced about trading — YouTube channels, forums, courses, social media accounts — skews heavily toward people who have either succeeded or who are building a following around the possibility of success. The failures are largely silent. They close their accounts, stop posting, and move on. What remains visible is a curated sample that dramatically overstates the fraction of people who make active trading work. This is survivorship bias operating at the level of the information environment itself, before a learner has made a single trade.
View original ASCII
The Information Environment a New Trader SeesAll Trading Outcomes ┌─────────────────────────────────────────┐ │ ░░░░░░░░░░░░░░░░░░░░░░░░░░░░░░░░░░░ │ ← Full distribution │ ░░░ Silent majority (losses/quit) ░░░ │ │ ░░░░░░░░░░░░░░░░░░░░░░░░░░░░░░░░░░░ │ │ ██████████ │ ← Visible online └─────────────────────────────────────────┘ ▲ What new learners see (survivorship-filtered)
The second force is the structure of learning. Trading education is organized around techniques, not decisions. Courses teach chart patterns, not the prior question of whether chart patterns generate reliable edge after costs. The skill-building content is abundant; the prerequisite reasoning is sparse.
The third force is motivation architecture. People come to trading with specific emotional energy — excitement about markets, a desire for financial independence, the appeal of skill-based competition. That energy is real and useful. But it is easier to channel into learning how to trade than into the more demanding work of asking whether to trade. The question "should I be doing this?" has the uncomfortable property of potentially producing the answer "no."
The result is that learners study winning strategies without accounting for the full distribution of outcomes — without modeling what happens to the median trader running a similar strategy, not just the visible successes.
The Decision Is Not Permanent — But Requires Honest Revisitation
Treating the active trading decision as a prerequisite gate does not mean it is a one-time verdict. The decision is revisable, and it should be revisited at each meaningful stage of the learning roadmap.
This matters because the relevant inputs change. Your cost structure changes as you develop broker relationships and refine your execution. Your time availability changes with life circumstances. Your genuine edge, if any, clarifies or fails to materialize as you accumulate live trading history. And markets themselves change, sometimes in ways that close edges that were previously accessible.
The structure of this roadmap is designed to support that revisitation. Some learners will work through the early tracks and conclude, with the benefit of real information, that passive indexing is the right answer for them. That is not a failure. That is the gate working as intended — preventing the more expensive alternative: reaching the end of a long learning journey and only then discovering that the question had a different answer than the one implicitly assumed at the start.
What This Lesson Does — and Doesn't — Do
This lesson does not tell you whether to trade actively. Whether active trading is worth pursuing depends on variables specific to your financial situation, tax treatment, time budget, risk tolerance, and realistic assessment of your ability to develop edge.
What this lesson does do is build the framework for asking the question rigorously — with the right inputs, the right comparisons, and the right awareness of where reasoning commonly goes wrong. The sections that follow cover the passive indexing baseline, the four categories of cost that active traders face, a practical method for estimating the edge a strategy must generate to justify its complexity, and the specific cognitive errors that distort this decision for most learners.
❌ Wrong thinking: "I'll figure out whether active trading is worth it after I learn enough to actually do it well."
✅ Correct thinking: "I'll build the framework for evaluating this decision now, use it as I learn, and update it as my actual cost structure and edge become clearer."
The difference between those two postures, compounded over the months or years of a learning journey, is substantial. The second produces a learner who is gathering evidence for a decision they're actively making. The first produces a learner who has already made the decision implicitly — by choosing to invest time — without ever examining it.
What You Are Actually Competing Against
Knowing the gate exists is not enough — you also need a precise picture of what stands on the other side of it. For most active traders, the true competitor is not the market in the abstract and not other traders. It is a remarkably unglamorous alternative: a broad market index fund sitting in a brokerage account, doing essentially nothing, slowly compounding.
The Passive Alternative: What It Actually Delivers
A broad market index fund tracks a market-wide index by holding a representative sample — or the full basket — of the securities in that index, spreading exposure across sectors, geographies, and company sizes. It delivers four things with minimal ongoing effort:
- Automatic diversification. A single position failure has limited impact on the overall portfolio. An active trader concentrating in ten or twenty names carries a fundamentally different risk profile.
- Automatic rebalancing. Market-cap-weighted funds naturally adjust as prices change; factor-weighted funds rebalance on schedule, with costs spread across the full investor base.
- Market-rate returns. An index fund delivers approximately the return of the market segment it tracks, minus a small fee. The compounding effect of consistent market-rate returns over long periods is substantial.
- Tax efficiency. Because index funds have low turnover, they generate minimal taxable events. The investor controls when to realize gains, enabling deliberate tax planning — a structural advantage we'll examine closely in the next section.
View original ASCII
Passive Investor                     Active Trader
─────────────────────────────────────────────────────
Buy index fund                       Research, select, execute
        │                                    │
        ▼                                    ▼
Market return - tiny fee             Gross return
                                            │
                            - Transaction costs
                            - Tax drag (short-term gains)
                            - Time cost
                            - Mistake cost
                                            │
                                            ▼
                                     Net return
─────────────────────────────────────────────────────
For active to win: Net return > (Market return - tiny fee)
Every cost category the active trader incurs is an additional gap they must close just to arrive at parity. The passive investor starts with a structural advantage, not a head start that disappears with skill.
The Compounding Gap: Why Small Drags Become Large Deficits
One of the most consistent intuition failures in active trading is underestimating how small annual performance gaps compound into large absolute differences over time. This is arithmetic, and it deserves to be seen concretely.
Starting capital: $100,000
Index net return: 8% per year

Trader A (1% net drag):   Effective annual return: 7%
Trader B (2% net drag):   Effective annual return: 6%

         Year 0    Year 5      Year 10     Year 20
Index:  $100,000  $146,933   $215,892    $466,096
A (-1%):$100,000  $140,255   $196,715    $386,968
B (-2%):$100,000  $133,823   $179,085    $320,714

Gap vs. Index at Year 10:
  Trader A: -$19,177 (-8.9%)
  Trader B: -$36,807 (-17.0%)

Gap vs. Index at Year 20:
  Trader A: -$79,128 (-17.0%)
  Trader B: -$145,382 (-31.2%)

(Simplified: assumes constant annual returns, ignores tax
 sequencing — the directional point holds broadly.)
A 1–2% annual drag does not produce a 10–20% underperformance over twenty years. It produces a 17–31% shortfall, because the drag compounds. At year twenty, Trader B has roughly two-thirds of what the index investor has — despite starting identically and matching the index's gross performance every single year. If Trader B is also underperforming on gross returns, which is the more common scenario, the gap widens further.
⚠️ Common Mistake: Evaluating a strategy by asking "Does it beat the index in gross return?" is incomplete. The correct question is: "Does it beat the index by enough — and consistently enough — to more than cover all costs over the full holding period?"
What Professional Managers Tell Us About the Difficulty
Research across large samples of actively managed funds — conducted over rolling periods of a decade or more — consistently finds that the majority of professional active managers do not outperform their benchmark index after fees over long measurement windows. The proportion of underperformers tends to grow as the measurement period lengthens, because compounding amplifies both edges and drags. Critically, the managers who outperform in one period do not reliably outperform in subsequent periods at a rate better than chance would predict.
What makes professional underperformance relevant to retail traders? Professional active managers have structural advantages most retail traders lack: full-time research teams, proprietary data services, lower transaction costs through scale, and years of experience navigating different market regimes. If this cohort does not reliably outperform the passive alternative after fees over long periods, that fact should recalibrate expectations for a part-time retail trader.
⚠️ Common Mistake: It is tempting to conclude, "Professional managers fail because they're constrained by fund size and regulatory requirements — I can be more nimble." Retail traders do have flexibility advantages in some niches. But the honest use of the professional evidence is to ask: does my specific structural advantage plausibly outweigh their structural advantages? For most retail traders, the honest answer is unclear — and "unclear" should raise the hurdle, not lower it.
The Benchmark Is a Specific Thing, Not a Vague Standard
"The index" is not one thing. A strategy concentrated in small-cap value stocks should not be compared to a large-cap index; a bond-focused strategy should not be compared to an equity index. The correct benchmark is the passive alternative a rational investor would hold instead of the active strategy — one with comparable risk exposure and market segment.
💡 Real-World Example: An active trader who focuses on small-cap growth stocks and beats a broad market index may have simply captured the small-cap growth factor premium — a return source available passively. A passive small-cap growth fund would be the appropriate benchmark. Compared against the right baseline, the same gross return might represent underperformance after costs.
When Beating the Index Is Not the Goal
Outperforming the benchmark is not the only legitimate purpose for active trading — but departing from it requires a conscious and specific substitution. There are genuinely valid reasons to accept lower expected returns than passive indexing:
🎯 Income generation. A retiree who needs regular cash flows may prefer an active income-oriented strategy over pure growth indexing, even if the long-run total return is lower. The return is being shaped, not just maximized.
🎯 Risk reduction or defined outcomes. Some investors want explicit downside protection or capped-volatility profiles that buy-and-hold cannot provide. That trade may be rational for specific circumstances.
🎯 Learning and engagement. Active involvement in markets has real educational and psychological value for some people — if the investor understands they are paying a tuition cost, not pursuing an alpha strategy.
The critical discipline is explicit substitution. If your goal is not to beat the index, name the alternative goal precisely — and then evaluate whether your active strategy actually delivers it, after costs.
❌ Wrong thinking: "I'm not trying to beat the index — I just want steady income, so the comparison doesn't apply to me."
✅ Correct thinking: "My goal is income. My benchmark is the passive income-oriented alternative for my risk profile. My active strategy must deliver more net income, or equivalent income with meaningfully lower risk, than that passive baseline — after all costs."
Vague alternative goals — "I want more control," "I want to be engaged" — are not testable and cannot justify the overhead of active management.
With a clear picture of the competitor, we can now turn to the specific costs that create the gap between gross return and net return.
The Four Real Costs of Active Trading
Most traders who abandon active trading do not fail because they chose the wrong strategy. They fail because they evaluated the right strategy against the wrong cost baseline. The four cost categories explored here — transaction costs, tax drag, time cost, and mistake cost — each seem manageable in isolation. The problem is that they do not arrive in isolation. They stack, they compound, and they apply simultaneously to every position in every market condition.
Cost One: Transaction Costs
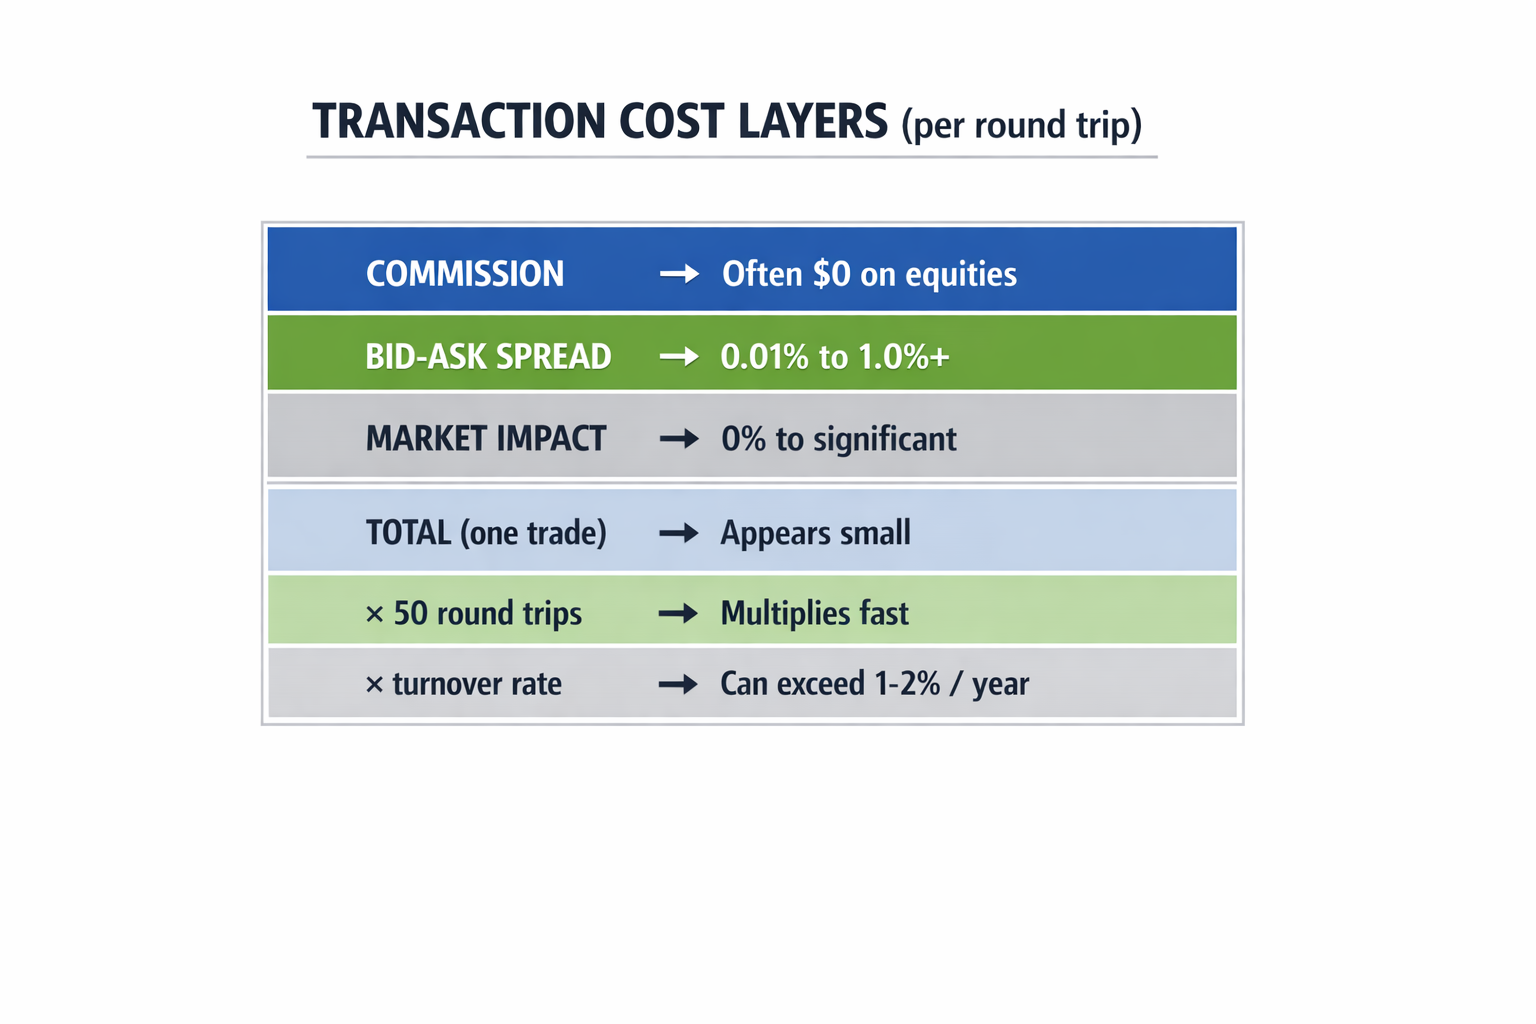
Transaction costs arrive in three distinct layers.
The first is commissions — the explicit fee per trade. Many retail brokers have moved to zero-commission structures on equity trades, which leads newer traders to conclude that transaction costs have been eliminated. This is a mistake. Commissions were always the smallest component.
The second is the bid-ask spread — the gap between the price a buyer pays and the price a seller receives. When you place a market order to buy, you transact at the ask. When you sell, you transact at the bid. On a liquid large-cap stock with a one-cent spread and a $50 share price, a round trip costs roughly 0.04%. On a less liquid mid-cap with a ten-cent spread and a $20 share price, the same round trip costs 1%. The difference in liquidity between normal and stressed market conditions can shift this cost by an order of magnitude.
The third is market impact — the price movement caused by the trade itself. A retail trader buying 100 shares of a highly liquid stock has essentially zero market impact. A trader accumulating a meaningful position in a thinly traded name will push the price higher as they buy and lower as they sell, creating a structural disadvantage that worsens with position size.
View original ASCII
TRANSACTION COST LAYERS (per round trip)┌─────────────────────────────────────────────┐ │ COMMISSION → Often $0 on equities │ │ BID-ASK SPREAD → 0.01% to 1.0%+ │ │ MARKET IMPACT → 0% to significant │ ├─────────────────────────────────────────────┤ │ TOTAL (one trade) → Appears small │ │ × 50 round trips → Multiplies fast │ │ × turnover rate → Can exceed 1-2% / year │ └─────────────────────────────────────────────┘
A portfolio turning over its entire value four times per year — not unusual for an active tactical trader — might incur a blended round-trip cost of 0.15% per trade across fairly liquid names. That is 0.60% per year in transaction drag before anything else. Against a passive index fund with an expense ratio well under 0.10%, the structural gap is meaningful before a single investment decision has been evaluated on its merits.
⚠️ Common Mistake: Evaluating transaction costs only on the commissions line. A broker advertising zero commissions has not made trading free — it has made the most visible cost disappear while spread and impact costs remain. Always estimate total round-trip cost.
Cost Two: Tax Drag
Transaction costs reduce the gross return you generate. Tax drag then reduces what you keep from whatever remains.
In most jurisdictions, short-term capital gains — profits on assets held for one year or less — are taxed as ordinary income. Long-term capital gains qualify for preferential rates. The structural principle is consistent: the faster you trade, the higher the tax rate on your profits.
A buy-and-hold index investor can defer capital gains taxes almost indefinitely. Unrealized gains compound untaxed. The investor controls the timing of realization — selling in a low-income year, using tax-loss harvesting, or holding until other planning opportunities arise. The ability to compound on pre-tax gains for years is a form of structural leverage that active traders systematically surrender.
TAX DRAG: ACTIVE vs. PASSIVE (illustrative)

  Year 1 gross gain: $10,000

  ACTIVE TRADER (short-term rates, ~37% marginal):
    Tax owed this year:  ~$3,700
    Reinvestable capital: ~$6,300

  INDEX INVESTOR (deferred, unrealized):
    Tax owed this year:  $0
    Reinvestable capital: $10,000

  (Simplified: ignores state taxes, deductions, exact rates;
   the directional point holds broadly across major jurisdictions.)
Tax drag is not just a percentage haircut on this year's returns — it is a reduction in the capital base that compounds forward. Over a decade, this compounding differential is often larger than the annual tax difference alone suggests.
Tax-advantaged accounts change this calculus significantly — trading inside a tax-sheltered wrapper eliminates the short-term gains penalty. This is a genuine structural advantage for active strategies in those accounts, and it is worth noting as the exception rather than a general escape hatch.
Cost Three: Time Cost
Time cost is the hardest to quantify and the easiest to ignore because it does not appear on any brokerage statement. It is, however, real.
Active trading requires research time (screening opportunities, reading filings, analyzing charts), monitoring time (tracking open positions, watching for entry or exit conditions), and decision time (evaluating whether to enter, add, reduce, or exit). A genuinely engaged active trader might spend several hours per week at the lower end, and substantially more with a complex portfolio across multiple instruments.
The opportunity cost of that time is not zero. Time spent on trading research is time not spent on a higher-earning career skill, a business, or restorative rest. The economically correct approach is to ask: what is the best alternative use of these hours, and what would that alternative produce? For a professional at the peak of their earning years, the implicit cost per hour may be high. For a retiree with abundant discretionary time, it may be near zero. The honest answer varies enormously — but the question must actually be asked.
💡 Mental Model: Suppose an active trader spends four hours per week on their portfolio — a modest estimate for someone trading regularly. That is roughly 200 hours per year. If those hours could alternatively generate $50 per hour in economic value, the implicit time cost is $10,000 per year. Against a $100,000 portfolio, that represents a 10% annual hurdle just from time, before any other cost is counted. The point is not that the number will always be this large — it is that most traders never calculate it at all.
Cost Four: Mistake Cost
Mistake cost is the category most resistant to honest accounting, because it requires traders to assign a probability and a cost to their own future errors. And yet for new traders especially, it is often the single largest cost category.
Mistakes in active trading fall into three systematic clusters.
Execution errors are mechanical mistakes: entering the wrong ticker, buying instead of selling, misreading order types, mismanaging stop-loss levels. These are near-universal among traders in their early years, and their cost distribution is heavily skewed — most executions go fine, but a single large execution error can impose a loss far larger than the cumulative gain from many successful trades.
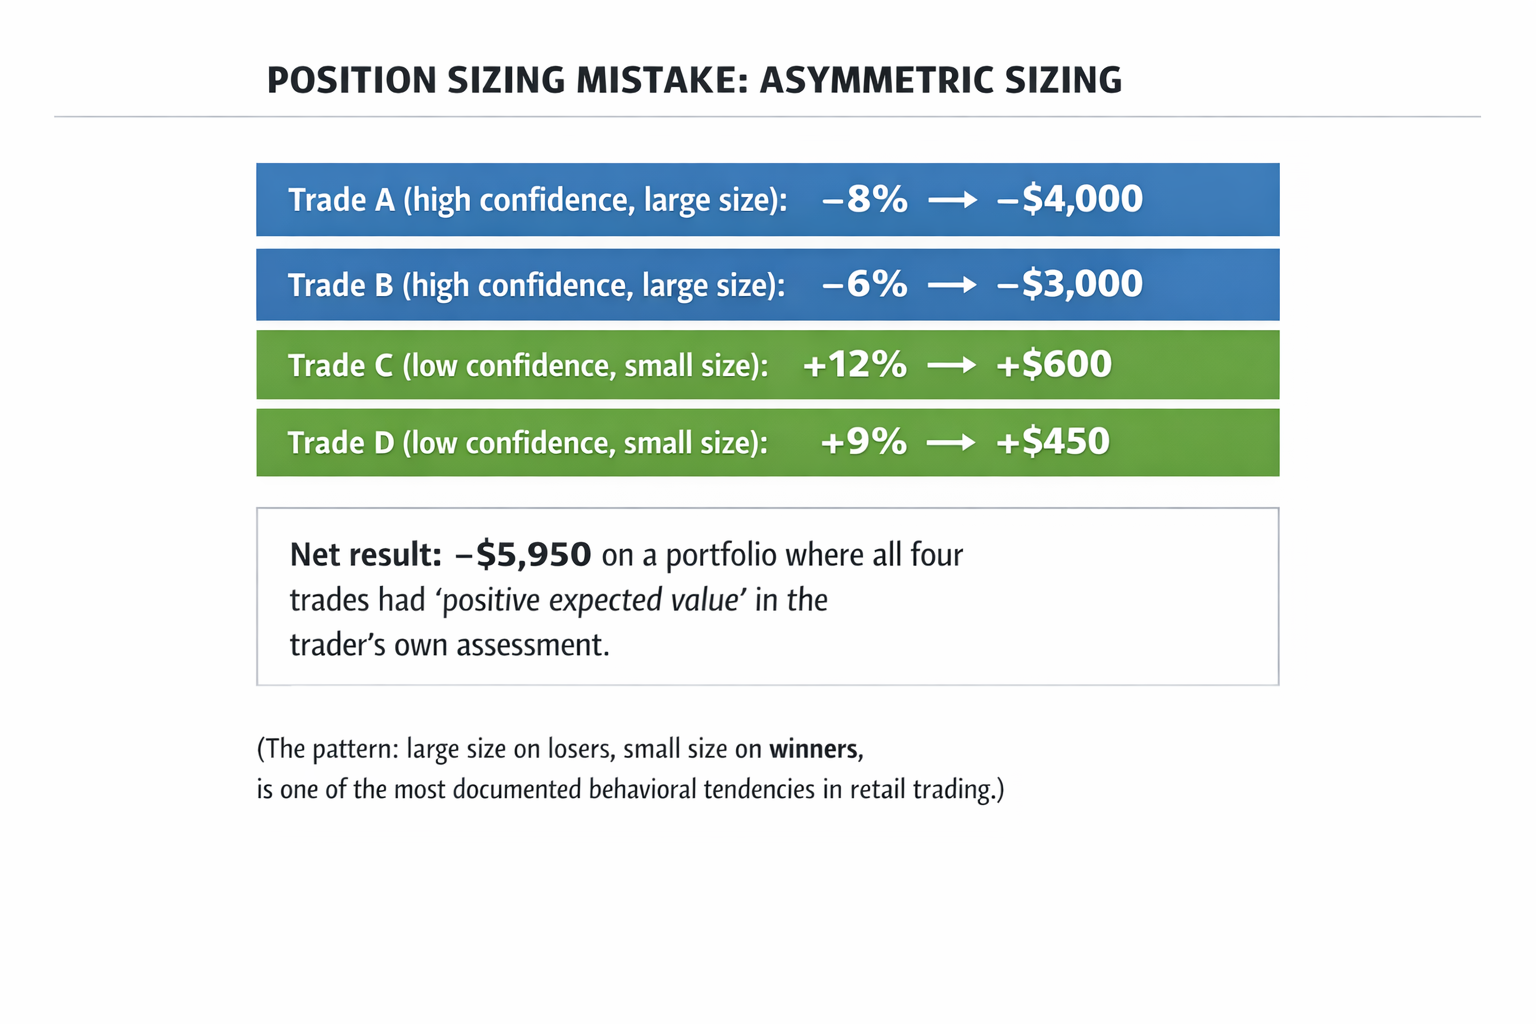
Position sizing errors are subtler and more persistent. They occur when a trader allocates too much capital to a single idea, adds to a losing position to reduce average cost (averaging down, which compounds exposure to a thesis the market is disagreeing with), or sizes positions inconsistently — large when confident, small when uncertain — so that the biggest bets correlate with the most emotional investment rather than the best objective odds.
View original ASCII
POSITION SIZING MISTAKE: ASYMMETRIC SIZINGTrade A (high confidence, large size): -8% → -$4,000 Trade B (high confidence, large size): -6% → -$3,000 Trade C (low confidence, small size): +12% → +$600 Trade D (low confidence, small size): +9% → +$450
Net result: -$5,950 on a portfolio where all four trades had 'positive expected value' in the trader's own assessment.
(The pattern: large size on losers, small size on winners, is one of the most documented behavioral tendencies in retail trading.)
Emotional decision-making — entering late because fear of missing out overrides process, holding losers too long because selling would force acknowledgment of a mistake, abandoning a valid strategy during a drawdown because the short-term pain feels intolerable — is not a character flaw. It is a predictable consequence of how human cognition responds to financial uncertainty with real money at stake. These patterns do not disappear automatically with experience; they require deliberate counter-conditioning through systems, rules, and post-trade review.
🎯 Key Principle: Mistake cost is not random noise. For new traders, it is systematically negative — errors on average cost money rather than saving it, and they cluster during high-volatility or high-stress periods when the stakes are highest. Any realistic return projection for a new active trader must include a negative adjustment for systematic errors in the early years.
How the Four Costs Stack
The critical insight is not that any single cost is fatal — it is that all four apply simultaneously and interact.
THE STACKING STRUCTURE OF ACTIVE TRADING COSTS

  GROSS STRATEGY RETURN
        │
        ▼
  − Transaction Costs    (spreads, impact, commissions)
        │
        ▼
  − Tax Drag             (short-term rates vs. deferred gains)
        │
        ▼
  − Time Cost            (opportunity cost of hours invested)
        │
        ▼
  − Mistake Cost         (execution, sizing, emotional errors)
        │
        ▼
  NET REALIZED RETURN
        │
        ▼
  vs. PASSIVE INDEX RETURN  ← the comparison that matters
A trader who underestimates even two of these four categories by half will produce a net return estimate that is structurally optimistic. The common experience of live results consistently underperforming backtested or paper-traded results is largely explained by this stack — the costs exist in live trading but are absent or underweighted in simulations.
📋 Quick Reference: The Four Cost Categories
| Category | What drives it | Reducible by |
|---|---|---|
| Transaction costs | Frequency, liquidity, size | Reducing turnover, trading liquid instruments |
| Tax drag | Holding period, tax bracket | Longer holds, tax-advantaged accounts |
| Time cost | Hours spent, opportunity value | Systematic, rules-based approach |
| Mistake cost | Experience, process discipline | Checklists, position rules, post-trade review |
🧠 Mnemonic: TTTM — Transaction, Tax, Time, Mistakes. The four costs that stand between your gross strategy return and the net return you actually keep.
With all four costs in view, the natural next question is: given my specific cost profile, how much gross outperformance does my strategy actually need to generate just to match the passive baseline?
A Framework for Sizing the Required Edge
Every active trading strategy carries an invisible debt that must be repaid before a single dollar of genuine value is created. That debt is the hurdle rate: the minimum gross outperformance your strategy must generate each year just to match what you would have earned by holding a low-cost index fund. Most traders never calculate this number explicitly. They evaluate strategies on gross returns, get excited when a backtest looks promising, and only discover the debt later — usually through the gradual experience of watching an active account fail to outpace its passive benchmark.
This section gives you a structured way to estimate your hurdle rate before committing to any strategy. The calculation is not a precise formula, but it is a disciplined way to force implicit assumptions into the open. A rough honest estimate is far more useful than the vague confidence most traders substitute for it.
The Core Equation
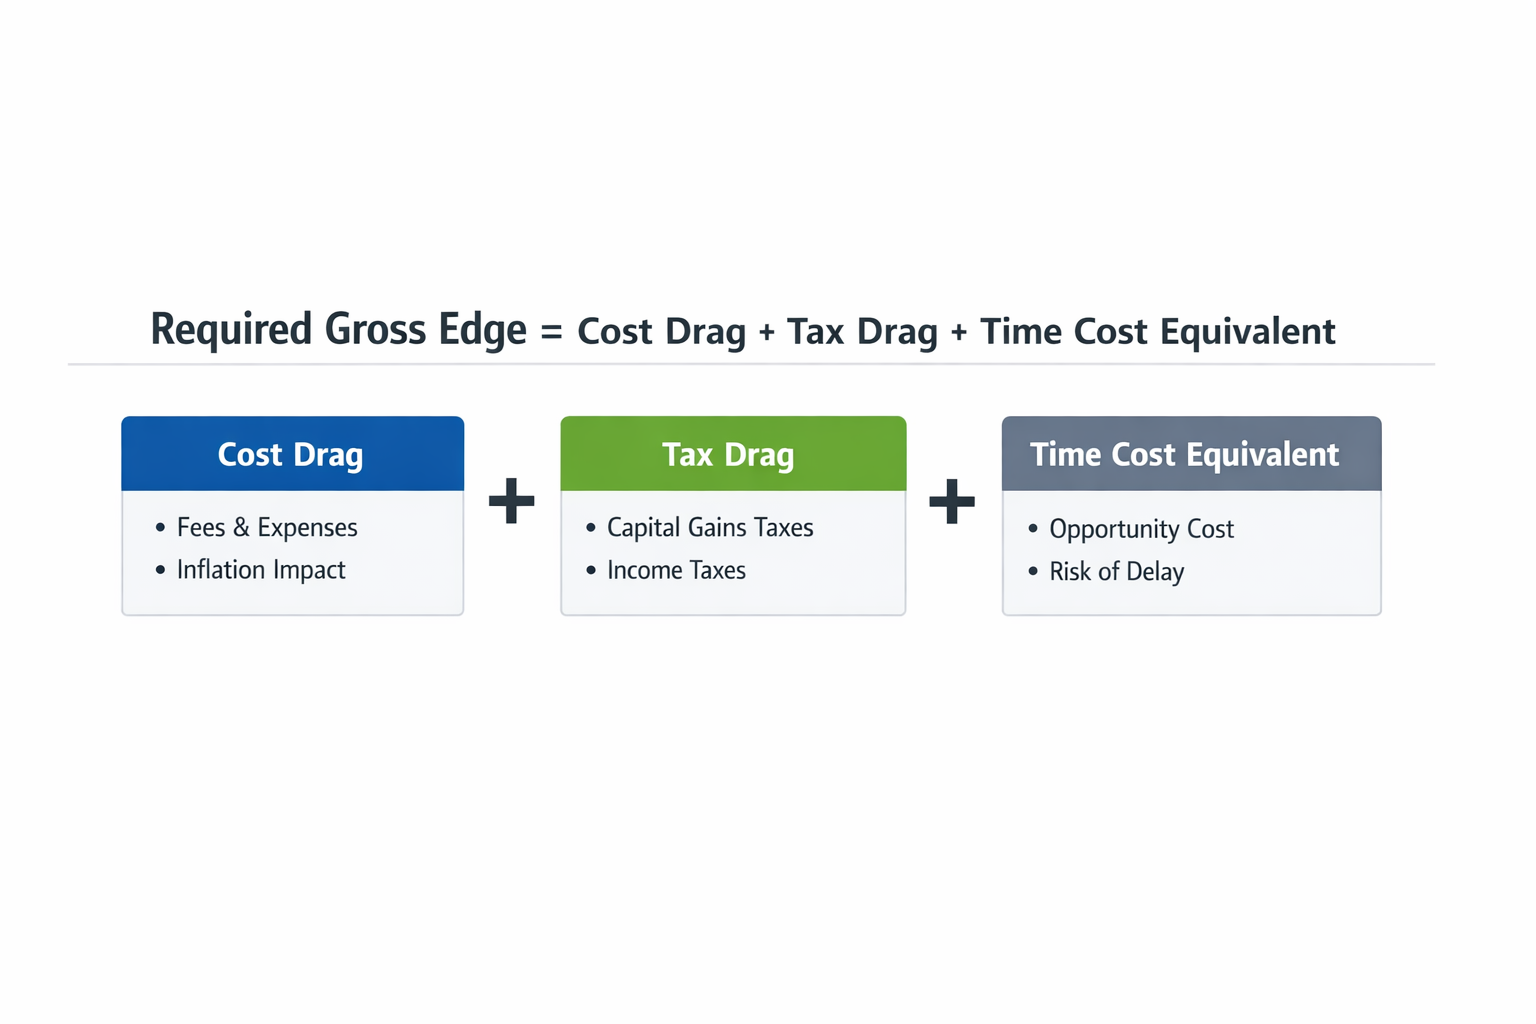
View original ASCII
Required Gross Edge = Cost Drag + Tax Drag + Time Cost Equivalent
Each component represents real drag on net returns — money that leaves your account or productivity you forfeit without any corresponding return. Your strategy must overcome all three simultaneously just to break even with the passive alternative.
🎯 Key Principle: The hurdle rate is not what your strategy needs to generate to be good. It is what your strategy needs to generate to be neutral — to merely match the passive alternative. Anything below the hurdle is a net negative outcome, even if absolute returns look positive in isolation.
Cost Drag
Cost drag is the sum of transaction costs as a percentage of your portfolio each year. For a trader with a small account making infrequent trades, this might be as low as 0.2–0.5% annually. For a higher-frequency tactical trader turning over the portfolio several times per year, the same per-trade costs can stack into 2–4% or more. The key input is your expected portfolio turnover — if round-trip transaction costs average 0.25% per trade and the portfolio turns over fully once annually, that costs 0.25% per year; double the turnover and the cost doubles.
Tax Drag
Tax drag is the additional tax liability active trading creates compared to buy-and-hold indexing, expressed as an annual percentage of portfolio value. A trader in a high marginal bracket who primarily holds positions for weeks or months might face an effective tax drag of 1–2% annually versus a buy-and-hold index investor deferring the same gains for years. A trader in a lower bracket, or operating inside a tax-advantaged account, will have a substantially lower tax drag.
Time Cost Equivalent
The time cost equivalent converts the hours invested in research, monitoring, and decision-making into an annualized percentage of your portfolio:
Time Cost Equivalent (%) = (Annual Hours × Hourly Rate) ÷ Portfolio Size × 100

Example:
  Annual hours:    500 hrs (≈10 hrs/week)
  Hourly rate:     $50
  Portfolio:       $200,000

  = (500 × $50) ÷ $200,000 × 100
  = 12.5% annual time drag
Smaller portfolios amplify this effect dramatically. The same 10 hours per week applied to a $20,000 account produces a 125% time drag — which makes the arithmetic case for active management at small portfolio sizes essentially impossible, regardless of skill. This is one reason experienced active traders often conclude the strategy only makes economic sense above a certain account threshold: the fixed time overhead becomes a tolerable fraction only at a large enough asset base.
A Worked Example
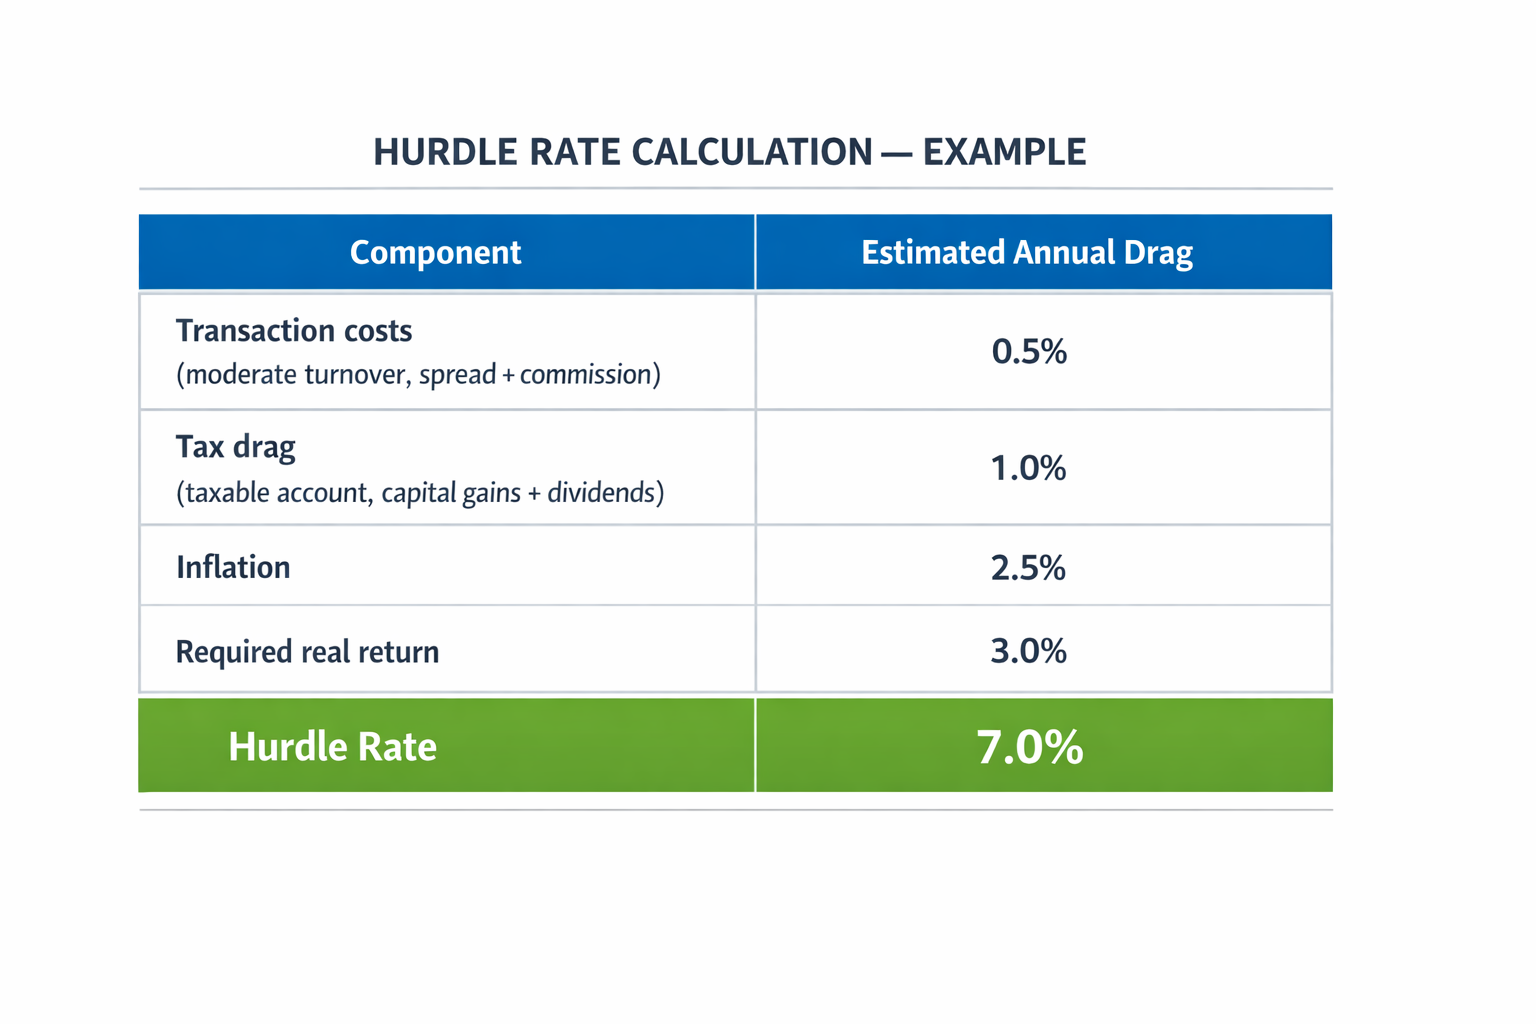
View original ASCII
┌─────────────────────────────────────────────────────┐
│           HURDLE RATE CALCULATION — EXAMPLE         │
├───────────────────────────┬─────────────────────────┤
│  Component                │  Estimated Annual Drag  │
├───────────────────────────┼─────────────────────────┤
│  Transaction costs        │  0.5%                   │
│  (moderate turnover,      │                         │
│   spread + commission)    │                         │
├───────────────────────────┼─────────────────────────┤
│  Tax drag                 │  1.0%                   │
│  (taxable account,        │                         │
│   mix of short/long-term  │                         │
│   gains, mid bracket)     │                         │
├───────────────────────────┼─────────────────────────┤
│  Time cost equivalent     │  1.0%                   │
│  (~4 hrs/week, $50/hr,    │                         │
│   implied ~$500K portfolio)│                        │
├───────────────────────────┼─────────────────────────┤
│  TOTAL HURDLE RATE        │  2.5%                   │
└───────────────────────────┴─────────────────────────┘
This trader needs to generate 2.5% in gross alpha — outperformance above the index before costs — just to break even with a passive investor who spent zero hours and paid near-zero costs. That 2.5% is not a profit target; it is the floor below which active management is actively destroying value relative to the do-nothing alternative.
Notice how specific the inputs are. The 1% time cost is derived from an actual estimate of hours and a deliberate choice about what those hours are worth. If you disagree with the $50/hr rate, substitute your own figure and recalculate. The framework's value is precisely that it forces this substitution to happen consciously.
How Hurdle Rates Vary by Trading Frequency
Different trading styles produce fundamentally different cost structures, which means they require fundamentally different levels of gross outperformance:
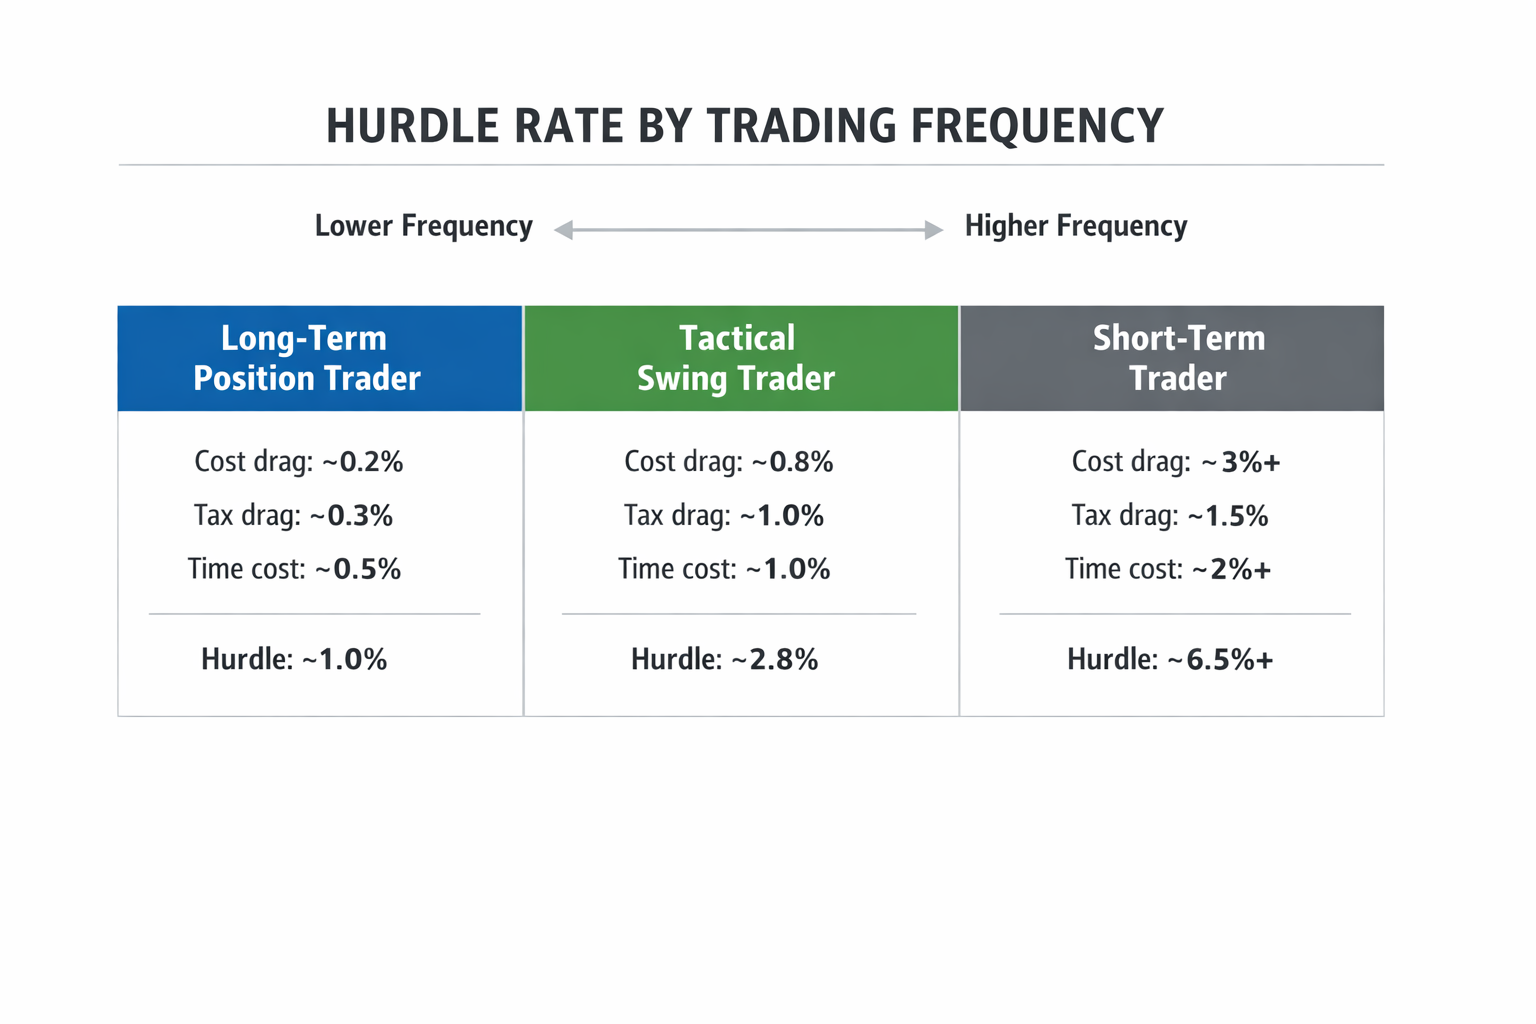
View original ASCII
HURDLE RATE BY TRADING FREQUENCYLower Frequency Higher Frequency ◄────────────────────────────────────────────────────►
Long-Term Tactical Short-Term Position Trader Swing Trader Trader ───────────── ────────────── ────────────── Cost drag: ~0.2% Cost drag: ~0.8% Cost drag: ~3%+ Tax drag: ~0.3% Tax drag: ~1.0% Tax drag: ~1.5% Time cost: ~0.5% Time cost: ~1.0% Time cost: ~2%+ ───────────── ────────────── ────────────── Hurdle: ~1.0% Hurdle: ~2.8% Hurdle: ~6.5%+
(Illustrative ranges — individual inputs will shift all figures substantially.)
The long-term position trader faces a relatively modest hurdle — perhaps 1–1.5% — because turnover is low, many gains may qualify for long-term rates, and research time per trade is spread across a long holding period. The tactical swing trader typically needs 2–4% gross alpha annually. The short-term active trader can face a hurdle easily reaching 5–8% or higher — which is why the burden of proof scales so steeply with frequency.
⚠️ Common Mistake: Traders who move from longer timeframes to shorter ones in pursuit of "more opportunities" often discover that the required edge at higher frequency exceeds the edge their original insight was generating. The strategy did not stop working — it was overtaken by the cost structure of the new trading style. Always recalculate your hurdle rate when you change trading frequency.
Using the Framework in Practice
The hurdle rate framework is most useful as a pre-commitment filter, applied before you invest time and capital in a new strategy.
🔧 Step 1 — Estimate your cost inputs honestly. Pull your actual transaction history and compute round-trip costs as a percentage of position size. Estimate your tax situation and what fraction of gains will be short-term. Track your time for two weeks to get a real estimate of hours per week.
🔧 Step 2 — Calculate your hurdle rate. Add the three components. If you are early in your trading development, add a reasonable allowance for mistake cost.
🔧 Step 3 — Compare to the strategy's expected gross edge. Where does your estimate come from? If it comes from a backtest, apply the skepticism warranted by backtesting limitations — a point developed in the next section.
🔧 Step 4 — Assess the margin of safety. A strategy whose expected gross edge barely clears the hurdle is not a sound foundation. Inputs are estimates, not certainties, and markets are variable. A comfortable margin above the hurdle accounts for that noise.
Build the hurdle rate calculation into a simple spreadsheet with your actual cost inputs. Update it once per year as your account size, trading frequency, and tax situation evolve. A strategy that clears the hurdle at one account size may fail to clear it if the portfolio shrinks or costs rise.
What This Framework Does and Does Not Tell You
The hurdle rate framework forces every major drag category to be estimated explicitly, which immediately reveals which assumptions are driving the conclusion. A trader who discovers their hurdle rate is 3.5% and their strategy is expected to generate 2% gross alpha has learned something concrete and actionable.
What it does less well: it treats each component as independent and additive, which is a simplification. Transaction costs reduce the capital base that tax drag applies to; time costs are partially unavoidable; mistake costs are correlated with market stress rather than uniformly distributed. The additive model overstates precision in these interactions, though this simplification rarely changes the conclusion significantly.
It also does not settle the question of whether active trading is worth doing for non-financial reasons — that belongs in a separate column, as we explore next.
Common Errors When Making This Decision
Every reasoning error described in this section shares the same structure: a shortcut that feels like analysis. The trader examines some evidence, draws a conclusion, and moves forward with confidence — but the evidence was selected or interpreted in a way that systematically overstates the case for active trading. These errors are not random. They cluster around the same decision point, bend in the same direction, and compound. A trader who commits even two or three simultaneously can enter an active strategy with a conviction that bears almost no relationship to what the evidence actually supports.
Error 1: Evaluating Backtests on Gross Returns
Gross return backtesting is the practice of running a strategy's historical performance through a model that records price changes but omits the costs that would have been incurred in actual trading. The result looks like a track record. It is not.
The costs omitted are the standard friction from the previous section: commissions, bid-ask spreads, market impact, and tax drag. In a backtest that ignores them, every trade executes at the exact midpoint price with no delay and no slippage. In live trading, the buy happens at the ask and the sell at the bid — and if the position is large enough relative to daily volume, the trader's own order moves the price against them before it fills.
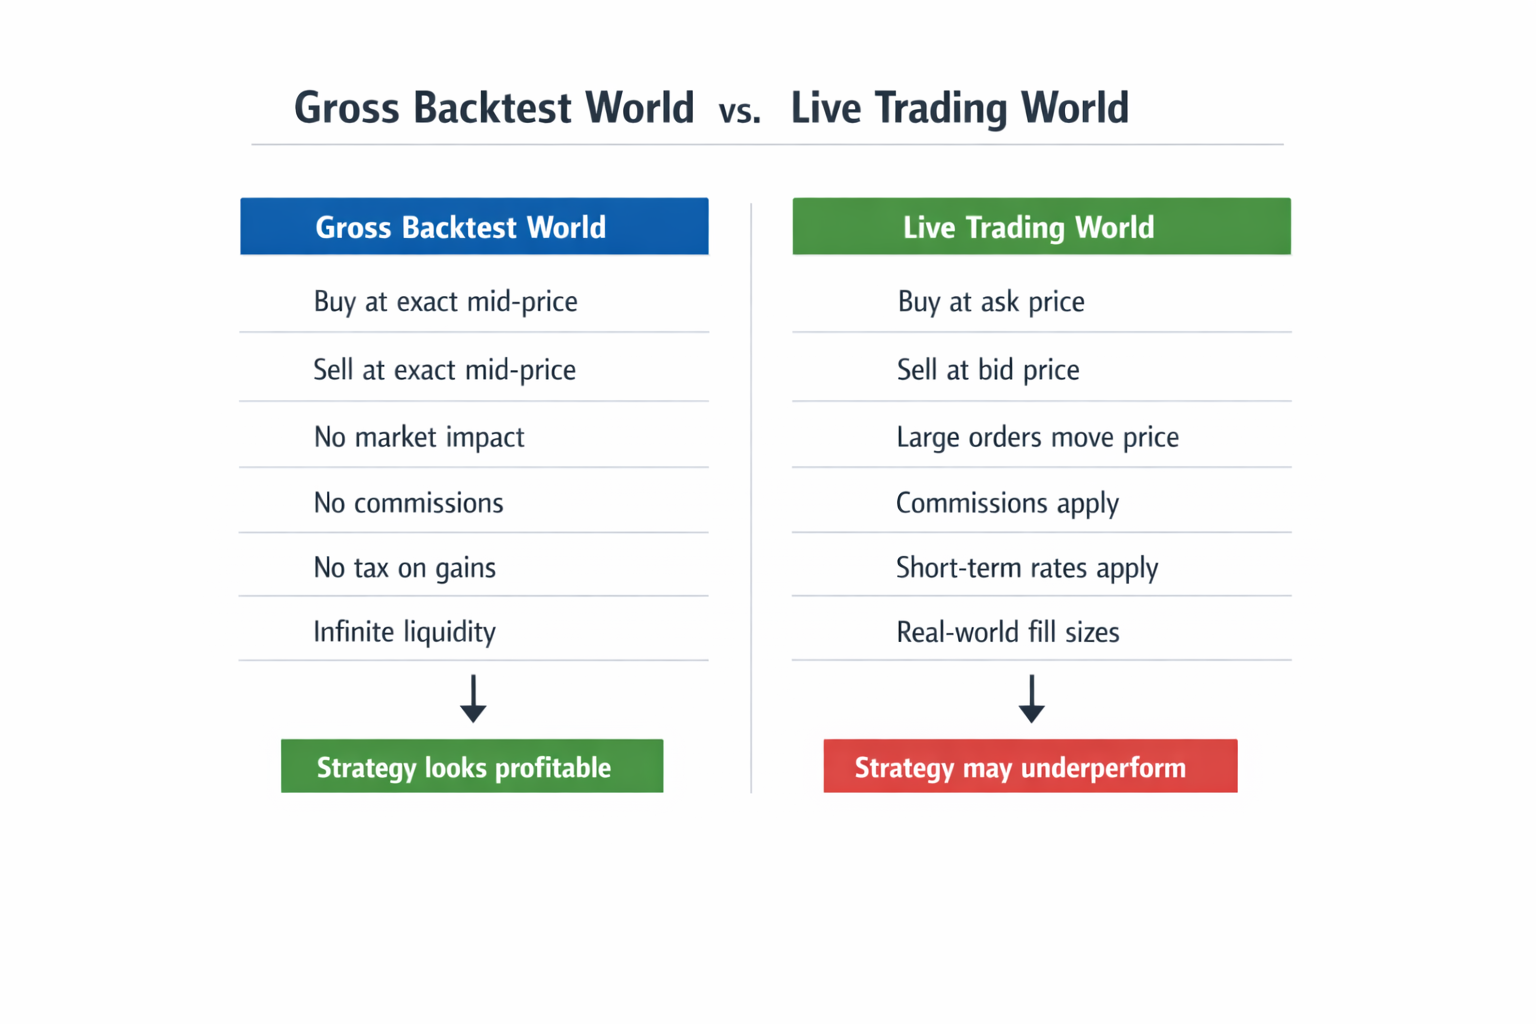
View original ASCII
Gross Backtest World         vs.      Live Trading World
─────────────────────                 ─────────────────────
Buy at exact mid-price                Buy at ask price
Sell at exact mid-price               Sell at bid price
No market impact                      Large orders move price
No commissions                        Commissions apply
No tax on gains                       Short-term rates apply
Infinite liquidity                    Real-world fill sizes
        ↓                                      ↓
Strategy looks profitable         Strategy may underperform
The error compounds further through overfitting: a strategy optimized on historical data often appears to generate alpha that is actually noise baked in during the design process. Costs do not overfit — they are real and stable. So the gross backtest flatters the strategy on two dimensions simultaneously: it inflates the return numerator and hides the cost denominator.
💡 Real-World Example: Consider a strategy that trades mid-cap equities twenty times per month. In a gross backtest it generates 14% annual returns. Now subtract realistic friction: 0.05% average spread per round-trip trade (20 trades × 2 legs × 0.05% = 2% annually), plus 1.5% in short-term tax drag. Net return drops to approximately 10.5%. If the index returns 10%, the "winning" strategy has become essentially a coin flip once execution variance is added — and that is before accounting for imperfect live fills.
The corrective is straightforward: before drawing any conclusion from a backtest, reconstruct the net return line. Apply realistic spread costs per round-trip, model slippage as a function of average daily volume, and estimate tax treatment at your marginal rate. If the strategy still clears the hurdle rate after those adjustments, it is worth continued analysis.
Error 2: Anchoring on Best-Case Outcomes
Outcome anchoring occurs when a trader uses a memorable high-water mark — a single spectacular trade, a friend's windfall, a highlighted success story — as the primary input for estimating what active trading will deliver.
The cognitive mechanism is well-understood: vivid, emotionally salient examples are recalled more easily than distributions. A trader who turned $5,000 into $18,000 on a single position in six weeks will remember that trade for years. The seven mediocre trades and two significant losses in the same period are remembered less clearly and weighted less heavily when forming expectations.
🎯 Key Principle: Expected return is a population statistic, not a highlight reel. It is calculated by weighting every outcome in the full distribution by its probability — including losses, wash trades, and near-misses. Using only the right tail of that distribution to estimate the mean is a mathematical error.
❌ Wrong thinking: "I made 40% on my best trade last year, so if I can do that a few times a year, I'll easily beat the index."
✅ Correct thinking: "My best trade returned 40%. My full trade history — including positions that lost money and went nowhere — produced an average return of X% per trade. That full-sample number is what I should use to project forward."
The corrective requires deliberate record-keeping. A trader who logs every position, including embarrassing exits, can compute a real average. Without that log, the mind defaults to anchoring on memorable trades — and the memorable ones are almost always the winners.
Error 3: Treating Paper Trading Results as Predictive
Paper trading — simulating trades without real money at risk — is a legitimate way to learn how an order entry system works or how to mechanically execute a strategy. It is a poor predictor of live performance.
The gap between paper results and live results has two main sources. The first is emotional pressure: when real capital is at risk, the cognitive load of holding a losing position is qualitatively different from watching a simulated loss tick downward. Research into decision-making under stress consistently finds that emotional arousal degrades the deliberate, rule-following behavior that trading strategies require. A trader who paper-trades with discipline often discovers on their first live week that they exit positions early, hesitate on entries, or override rules they followed perfectly in simulation.
The second source is execution reality: paper trading platforms typically fill orders at the last-quoted price with no queue, no partial fills, and no market impact. In live markets, a limit order may not fill at all if price moves through it quickly. A market order in a thinly traded name fills at a worse price than the quoted ask. For strategies that depend on precise entry and exit timing, execution slippage can account for a meaningful fraction of the expected edge.
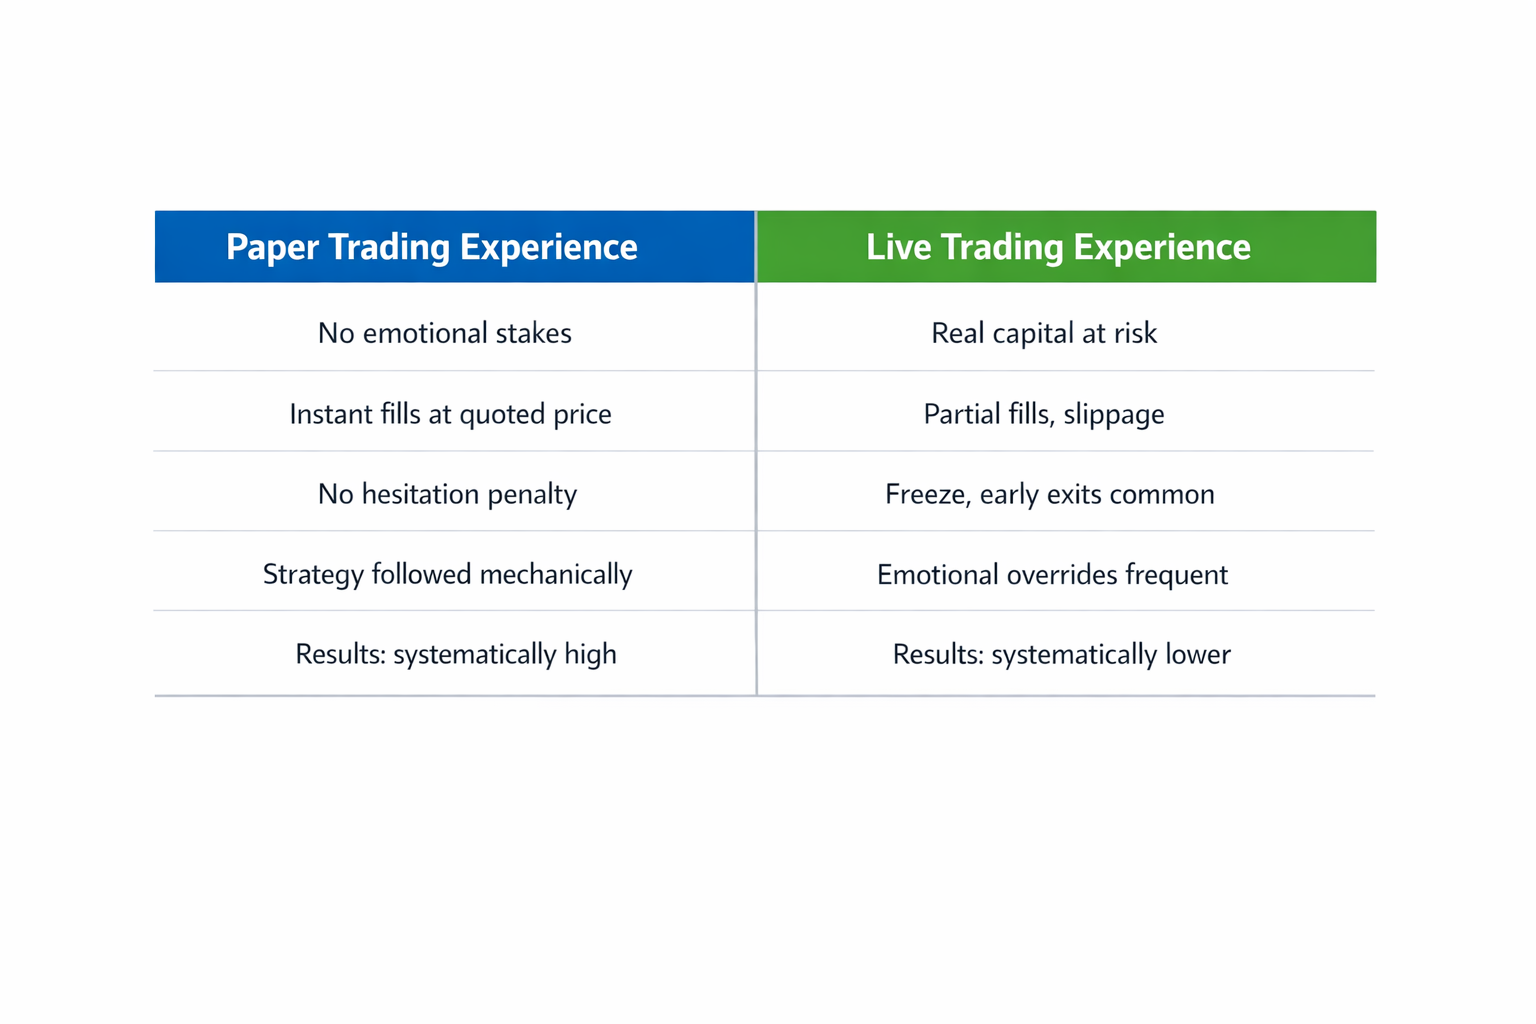
View original ASCII
Paper Trading Experience          Live Trading Experience
───────────────────────           ───────────────────────
No emotional stakes               Real capital at risk
Instant fills at quoted price     Partial fills, slippage
No hesitation penalty             Freeze, early exits common
Strategy followed mechanically    Emotional overrides frequent
Results: systematically high      Results: systematically lower
Paper results set an upper bound on expected live performance for most beginners — not a central estimate. The transition to live trading should begin at the smallest viable position size, not at full scale, precisely because the behavioral gap needs to be measured and managed before the trader knows how large it will be for them personally.
Error 4: Ignoring the Time Dimension of Outperformance
A trader who beats the index over a twelve-month period has one data point. Whether that data point is evidence of genuine edge or the expected result of random variation requires statistical reasoning — and most traders skip it entirely.
This error takes a specific form: single-year attribution, in which a trader concludes from one year of outperformance that their approach is sound. Over any given year, roughly half of all randomly selected portfolios will outperform the index by construction before costs, and a subset will outperform by a meaningful margin purely by chance. Without knowing the distribution of possible outcomes for a given strategy, a single year of data cannot distinguish skill from luck.
The time dimension error has a second layer: risk-adjusted comparison. A portfolio that returns 15% against an index that returns 10% appears to have generated 5% of alpha. But if that portfolio held concentrated positions in volatile assets while the index held hundreds of diversified names, the trader accepted substantially more risk for that outperformance. The relevant comparison is not "did I earn more?" but "did I earn more per unit of risk accepted?" An honest assessment requires tracking not just returns but drawdowns, volatility, and how the portfolio behaved during the period's worst stretches.
❌ Wrong thinking: "I returned 18% last year and the index returned 11%. I beat it by 7%. My approach works."
✅ Correct thinking: "I returned 18% versus 11% — a 7% gap. Was my portfolio more volatile? Did I hold concentrated positions that could have gone the other way? How many years would I need to observe this gap before random variation becomes an unlikely explanation? What was my maximum drawdown compared to the index's?"
The corrective is not to demand a decade of data before concluding anything — that standard would be impractical. It is to hold single-year conclusions loosely and frame them as weak evidence rather than confirmation. Multi-year records spanning both rising and falling markets carry far more weight.
Error 5: Conflating Enjoyment with Financial Superiority
This error is different in character from the previous four. It is not a logical flaw in analyzing returns — it is a category confusion between two separate questions:
- Is active trading financially superior to passive indexing for me, after all costs?
- Do I find active trading engaging, stimulating, or personally meaningful?
These are genuinely independent questions. Active trading can be financially inferior to indexing and deeply enjoyable. Treating a strong "yes" to question 2 as evidence for question 1 is the error.
The conflation typically surfaces as: "I love following markets, I spend hours on analysis every week, and I'm highly motivated — surely that translates into returns." Motivation and engagement tend to reduce careless errors from inattention. But they do not overcome structural headwinds like tax drag or the base rates of active management outcomes.
🎯 Key Principle: Enjoyment is a valid standalone justification for active trading at an appropriate scale — but it must be recognized as a consumption preference, not a return argument. A person who spends time and capital on active trading because they enjoy it, while believing they are generating superior financial outcomes when they are not, is making an error.
The practical resolution is a deliberate split:
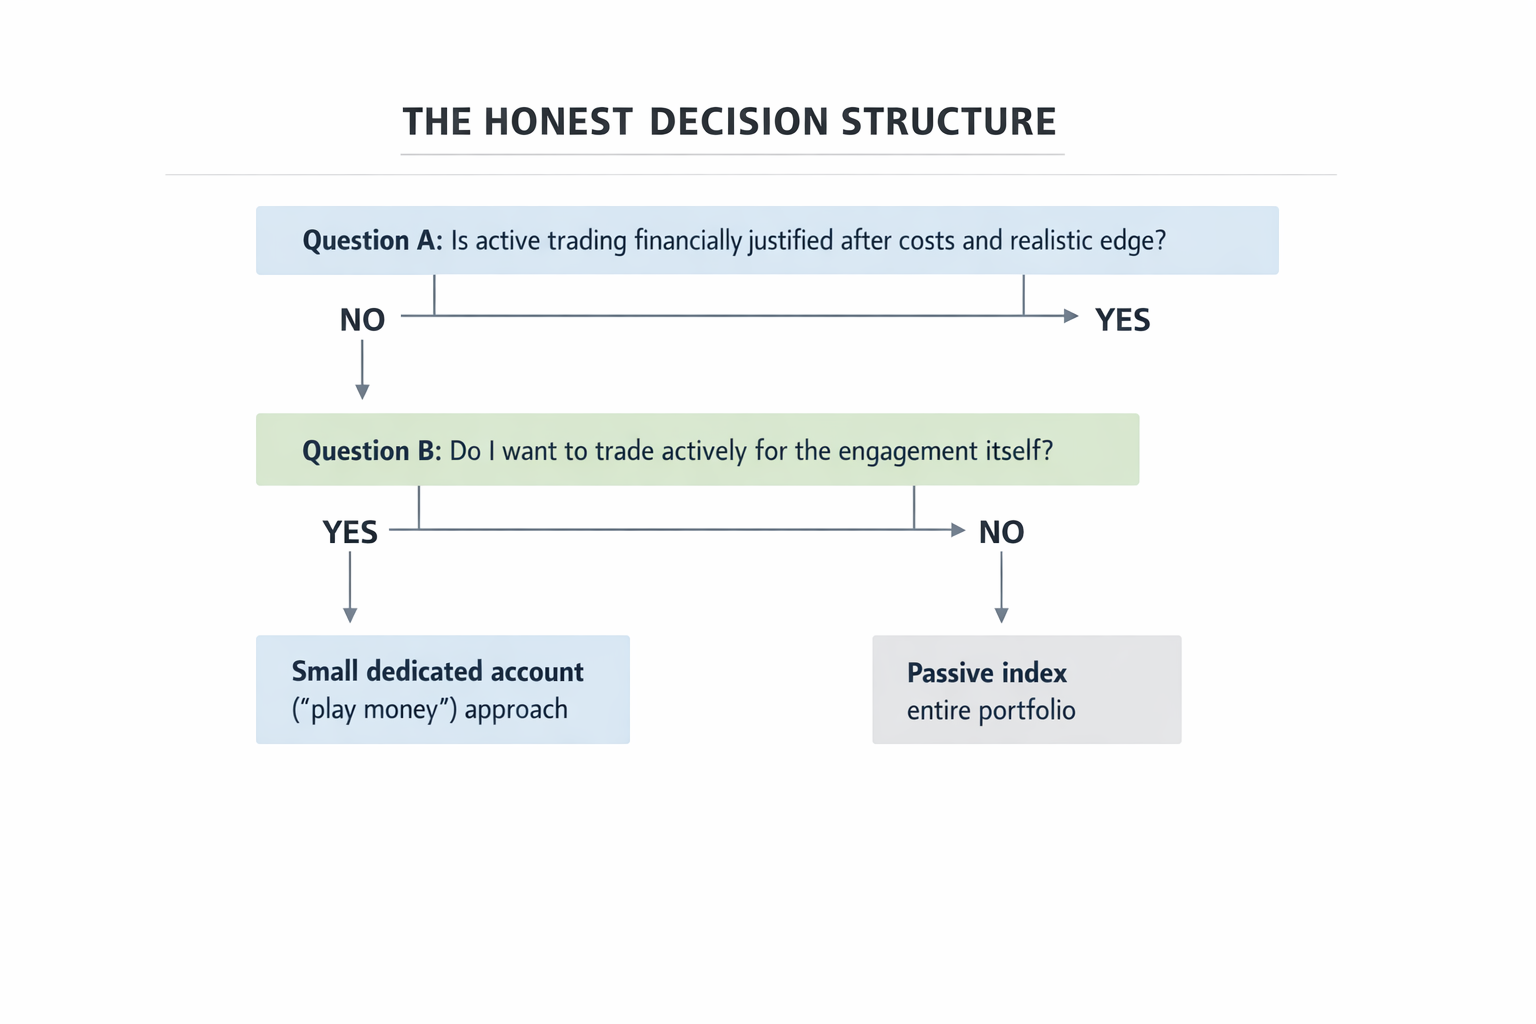
View original ASCII
THE HONEST DECISION STRUCTURE
         ─────────────────────────────
Question A: Is active trading financially
justified after costs and realistic edge?
YES ──────────────────────┐
NO  ──────────┐           │
↓           ↓
Question B: Do I want to trade
actively for the engagement itself?
│           │
YES         NO
↓           ↓
Small dedicated    Passive index
account ('play     entire portfolio
money') approach
Separate from
core portfolio
A trader who genuinely enjoys active trading can allocate a defined, modest portion of their portfolio to it — fully accepting that this portion may underperform — without distorting their overall financial plan. The key discipline is the separation: the active account is sized at a level where underperformance is affordable, not at a level where the outcome materially affects long-term financial security.
Putting the Five Errors Together
These errors rarely appear in isolation. A typical decision process for a new trader might look like this: they run a backtest on gross returns (Error 1), feel encouraged, recall their best-ever trade as a reference point (Error 2), confirm the strategy in a profitable paper trading period (Error 3), spend one successful year live trading and declare validation (Error 4) — all while feeling so energized that the engagement itself feels like evidence of aptitude (Error 5). Each individual error is moderate in its distortion. The compounded effect is a trader highly confident in a decision that was never rigorously made.
📋 Quick Reference: The Five Decision Errors
| Error | What It Inflates | The Correction |
|---|---|---|
| Gross return backtesting | Apparent historical edge | Rebuild net returns with realistic cost model |
| Anchoring on best-case outcomes | Expected future return | Use full-sample trade log averages |
| Paper trading as predictor | Confidence in live execution | Treat paper results as upper bound only |
| Single-year attribution | Certainty of skill over luck | Require multi-year, risk-adjusted comparison |
| Enjoyment as profitability evidence | Perceived financial edge | Separate preference question from return question |
Key Takeaways and What Comes Next
This lesson has made one sustained argument: before you study how to trade actively, you must decide whether to trade actively — and that decision requires a structured comparison against a specific alternative, not a vague belief in your own ability to outperform.
The Core Claims
Claim 1: The passive index is the correct baseline — not other active strategies and not absolute returns in isolation.
Every active strategy starts behind the passive benchmark and must climb uphill to match it, let alone surpass it. An active strategy that genuinely delivers superior risk-adjusted returns after all costs is worth pursuing. The passive benchmark simply ensures you are measuring that claim against the right standard.
Claim 2: Four cost categories must each receive an honest estimate before any active approach can be fairly evaluated.
Transaction costs, tax drag, time cost, and mistake cost each carry a different character. The important discipline is estimating all four before evaluating a strategy, not after. Estimating costs after you have already decided you like a strategy is a recipe for motivated reasoning.
Claim 3: A hurdle rate calculation, however rough, is more useful than vague confidence.
The moment you write down your four cost estimates and add them up, you have forced yourself to commit to a number. That number can be challenged, refined, and updated. Vague confidence cannot be challenged at all — which is exactly why it persists.
Summary Reference
📋 The Active Trading Decision Framework
| Concept | What It Means in Practice | Common Failure Mode |
|---|---|---|
| Passive Index as Baseline | Every active strategy is measured against a low-cost index fund | Comparing against a worse active strategy or cash position |
| Transaction Costs | Commissions, spreads, and market impact — small individually, additive at scale | Focusing only on visible commissions; ignoring spread and slippage |
| Tax Drag | Short-term gains taxed at ordinary income rates; buy-and-hold defers tax | Evaluating pre-tax returns without modeling the after-tax gap |
| Time Cost | Research and monitoring time carries an opportunity cost | Treating time as free because it is not a cash outlay |
| Mistake Cost | Execution errors and emotional decisions are predictable for new traders | Assuming paper trading performance transfers to live trading intact |
| Hurdle Rate | Sum of all four cost categories — the gross alpha needed just to match the index | Running the calculation on best-case inputs rather than realistic ones |
Applying This Before Moving On
Before the next lesson, two concrete checkpoints are worth completing.
Draft your own cost estimate. Pull a rough number for each of the four categories, applied to the kind of trading you are actually considering. For example, a moderate-frequency position trading approach might look like:
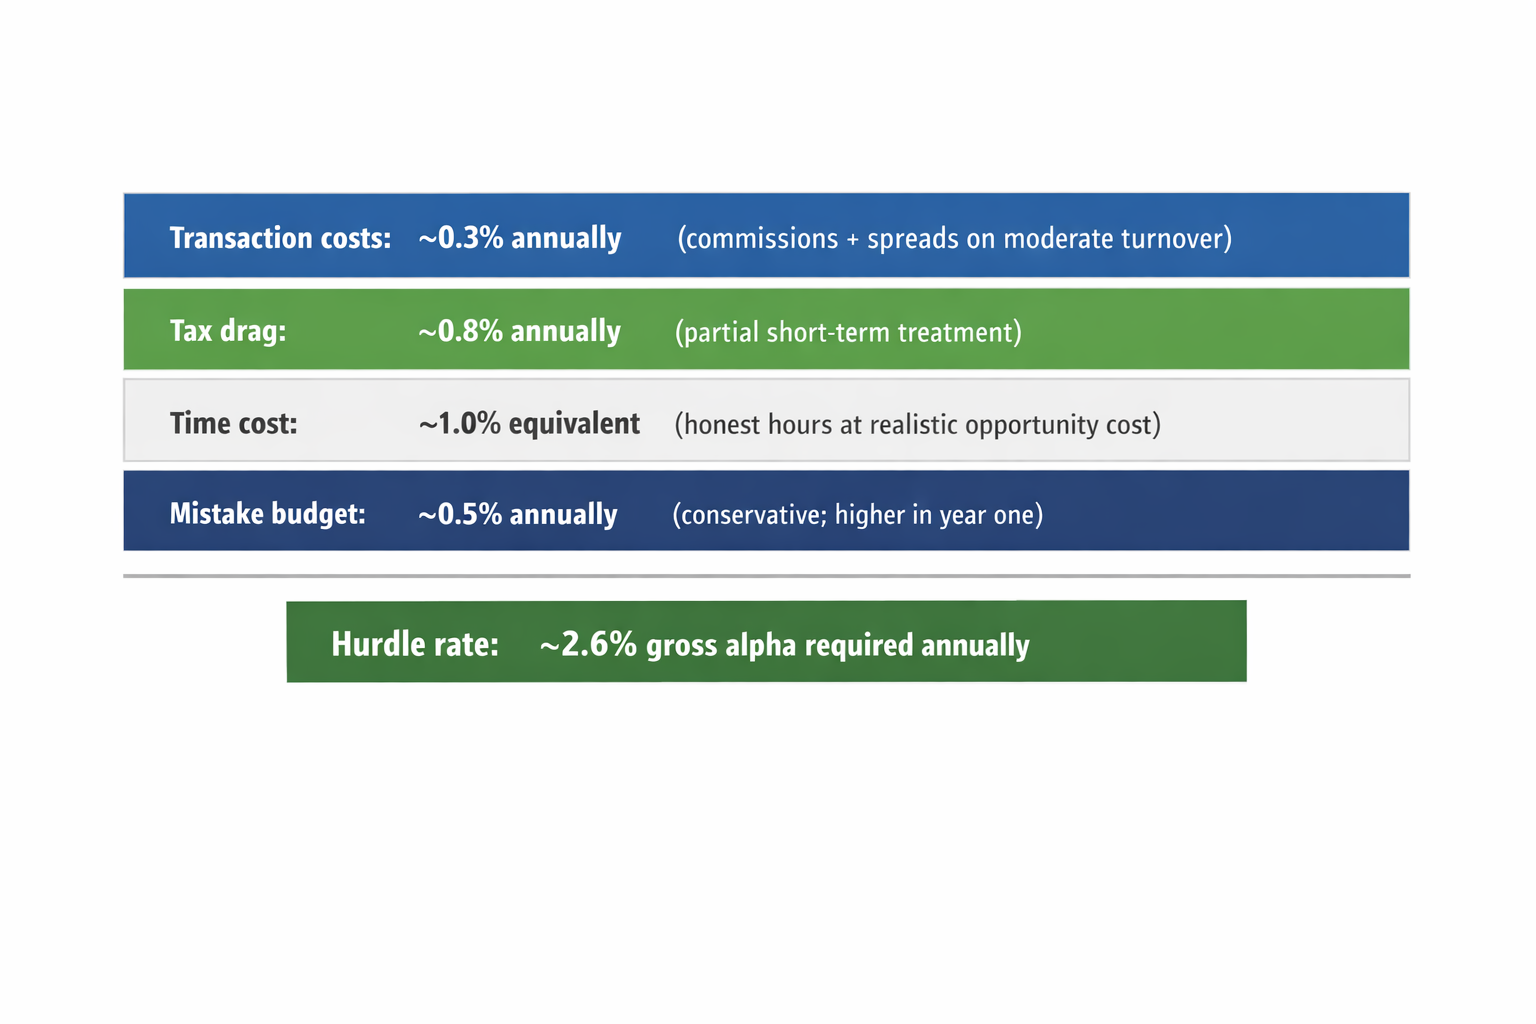
View original ASCII
Transaction costs:  ~0.3% annually (commissions + spreads on moderate turnover)
Tax drag:           ~0.8% annually (partial short-term treatment)
Time cost:          ~1.0% equivalent (honest hours at realistic opportunity cost)
Mistake budget:     ~0.5% annually (conservative; higher in year one)
────────────────────────────────────────────────────────────────
Hurdle rate:        ~2.6% gross alpha required annually
The specific numbers matter less than the discipline of making four separate, honest estimates instead of one hand-wavy belief that your edge is good enough.
State your specific alternative goal, if not index-beating returns. If your goal is income generation, defined-outcome exposure, or reduced correlation to broad market drawdowns, write it down in testable form. Vague goals survive contact with poor performance; explicit goals do not — which is precisely what makes them useful.
What the Next Two Lessons Cover
┌─────────────────────────────────────────────────────────────┐
│              THE ACTIVE TRADING DECISION (this lesson)       │
│   Framework: passive baseline + four costs + hurdle rate     │
└────────────────────┬────────────────────────────────────────┘
                     │
          ┌──────────┴───────────┐
          │                      │
          ▼                      ▼
┌──────────────────┐   ┌──────────────────────────────┐
│  Track 1:        │   │  Track 2:                    │
│  The Passive     │   │  The Burden of Proof         │
│  Benchmark       │   │  for Active Management       │
│  in Detail       │   │                              │
│                  │   │                              │
│  What the index  │   │  How to evaluate whether     │
│  actually        │   │  a specific active strategy  │
│  delivers —      │   │  genuinely clears the        │
│  mechanics,      │   │  hurdle you just calculated  │
│  limits, and     │   │                              │
│  real costs      │   │                              │
└──────────────────┘   └──────────────────────────────┘
The next lesson — on the passive benchmark in detail — matters because the baseline you are comparing against is not a single thing. Different index funds track different indices, carry different costs, and behave differently in drawdowns. A trader who does not understand what the passive benchmark actually delivers will set an imprecise hurdle rate, which undermines the entire framework built here.
The lesson after that — on the burden of proof — provides the rigorous method for evaluating whether a candidate active strategy's historical performance, risk profile, and real-world implementation genuinely clear the bar. Knowing your hurdle rate is necessary but not sufficient; you also need a structured way to test whether a strategy actually meets it.
The ordering is deliberate: you cannot evaluate a strategy against a baseline you do not understand, and you cannot calculate a hurdle rate without understanding what the passive alternative costs.
The Mindset to Carry Forward
Every technique covered in the tracks ahead — trend following, mean reversion, options strategies, position sizing methods — should eventually be run through the following filter:
1. What is the realistic gross return expectation for this technique?
2. What are the four cost categories for this specific implementation?
3. Does the net return, after honest cost estimates, clear the hurdle rate?
4. If not, what would need to be true about my edge for it to do so —
   and is that realistic?
That filter is not a reason to reject every active technique. It is a reason to evaluate them honestly rather than enthusiastically. The traders who apply it consistently tend to arrive at one of two outcomes: they find a genuine edge worth developing, or they recognize early that indexing is the better choice for their situation. Either outcome is more valuable than years spent trading without ever asking the question rigorously.
⚠️ Three things to remember as you proceed:
The comparison is always to the passive index, not to other active strategies. Showing that your approach beats a poor fund or a friend's stock picks is not evidence of edge.
Hurdle rate calculations go stale. Your cost profile changes as your strategy evolves, your account size changes, and tax law shifts. Revisit the estimate annually and whenever your approach changes materially.
Enjoyment is a legitimate reason to trade actively at small scale — but it is a separate consideration from financial superiority. Name it as such, rather than allowing it to blur the financial comparison.
The foundation is in place. The next lesson takes you inside the passive benchmark to understand exactly what you are competing against — and what it genuinely costs to match.